Metrics Building - Basics
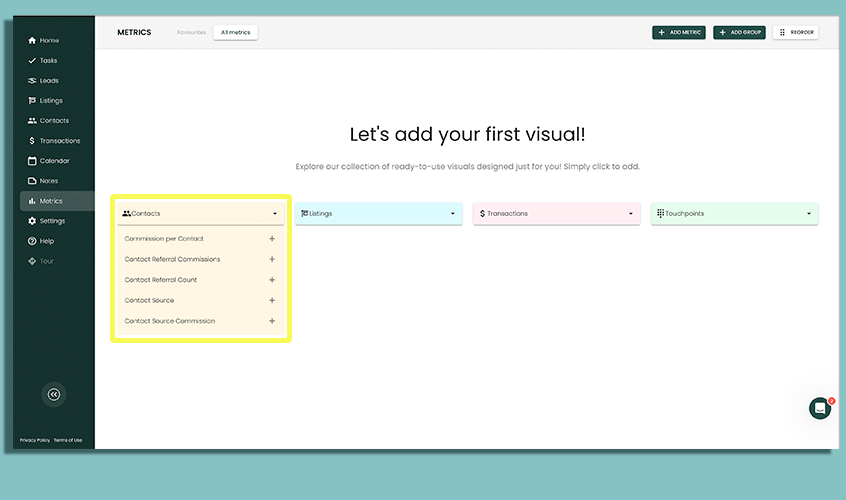
If you are first starting out with Metrics, you’ll be greeted with a screen with four categories of Metrics to choose from. From here, select what category you want to begin with, and select an option that suits your needs.
If you already have created Metrics, you can add additional metrics by selecting the Add Metric button from the top menu bar. This will launch a similar menu item for your selection.
Click to Show Screenshot
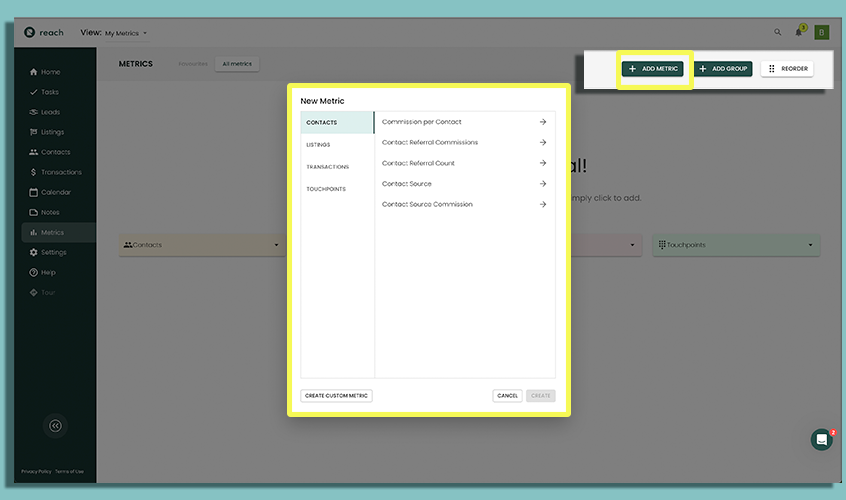
Example: Commission Per Contact
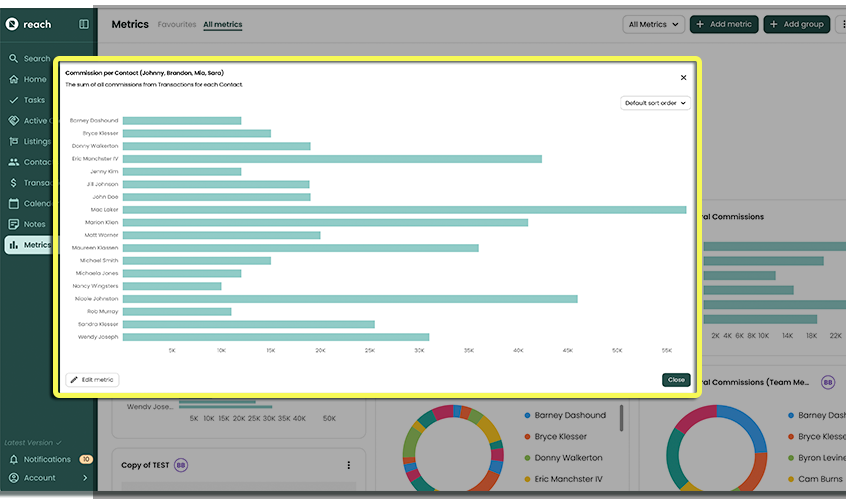
In this example, we want to visually see our Commissions per Contact which will display results of our top performing Contacts, and the value of that commission over the life of the Contact.
- Start by selecting Contacts to open the Contact Metrics options
Reach now asks a couple simple questions
- Title: Specify a title for your Metric.
- Visual: Select how you would like your data to be visualized.
- If you’re on a team, with other Reach users, you will see an option to select Whose contacts would you like to filter by. This initial option allows you to build metrics for contacts you have permission to view/edit based on your team settings.
Then select Create
Viewing Your Metric
By clicking on the metric/chart on the dashboard, you can expand the Metric to full screen view. You can also sort the data in a Metric by selecting Sort in the top right corner when in expanded / full screen mode.
Congrats! You’ve built your metric.
Other Metrics are available, and we invite you to explore the other pre-built Metrics available.